All of these data storytelling projects have been made using DataWrapper, Adobe Illustrator, ai2html, QGIS, Mapshaper & JavaScript (specifically d3.js, three.js, webGL, Vue.js, grunt.js or SvelteKit).
Made under the supervision of Alyson Hurt, Connie Hanzhang Jin, Rahul Mukherjee, Richard The, Daniel Sauter & Sam Lavigne.
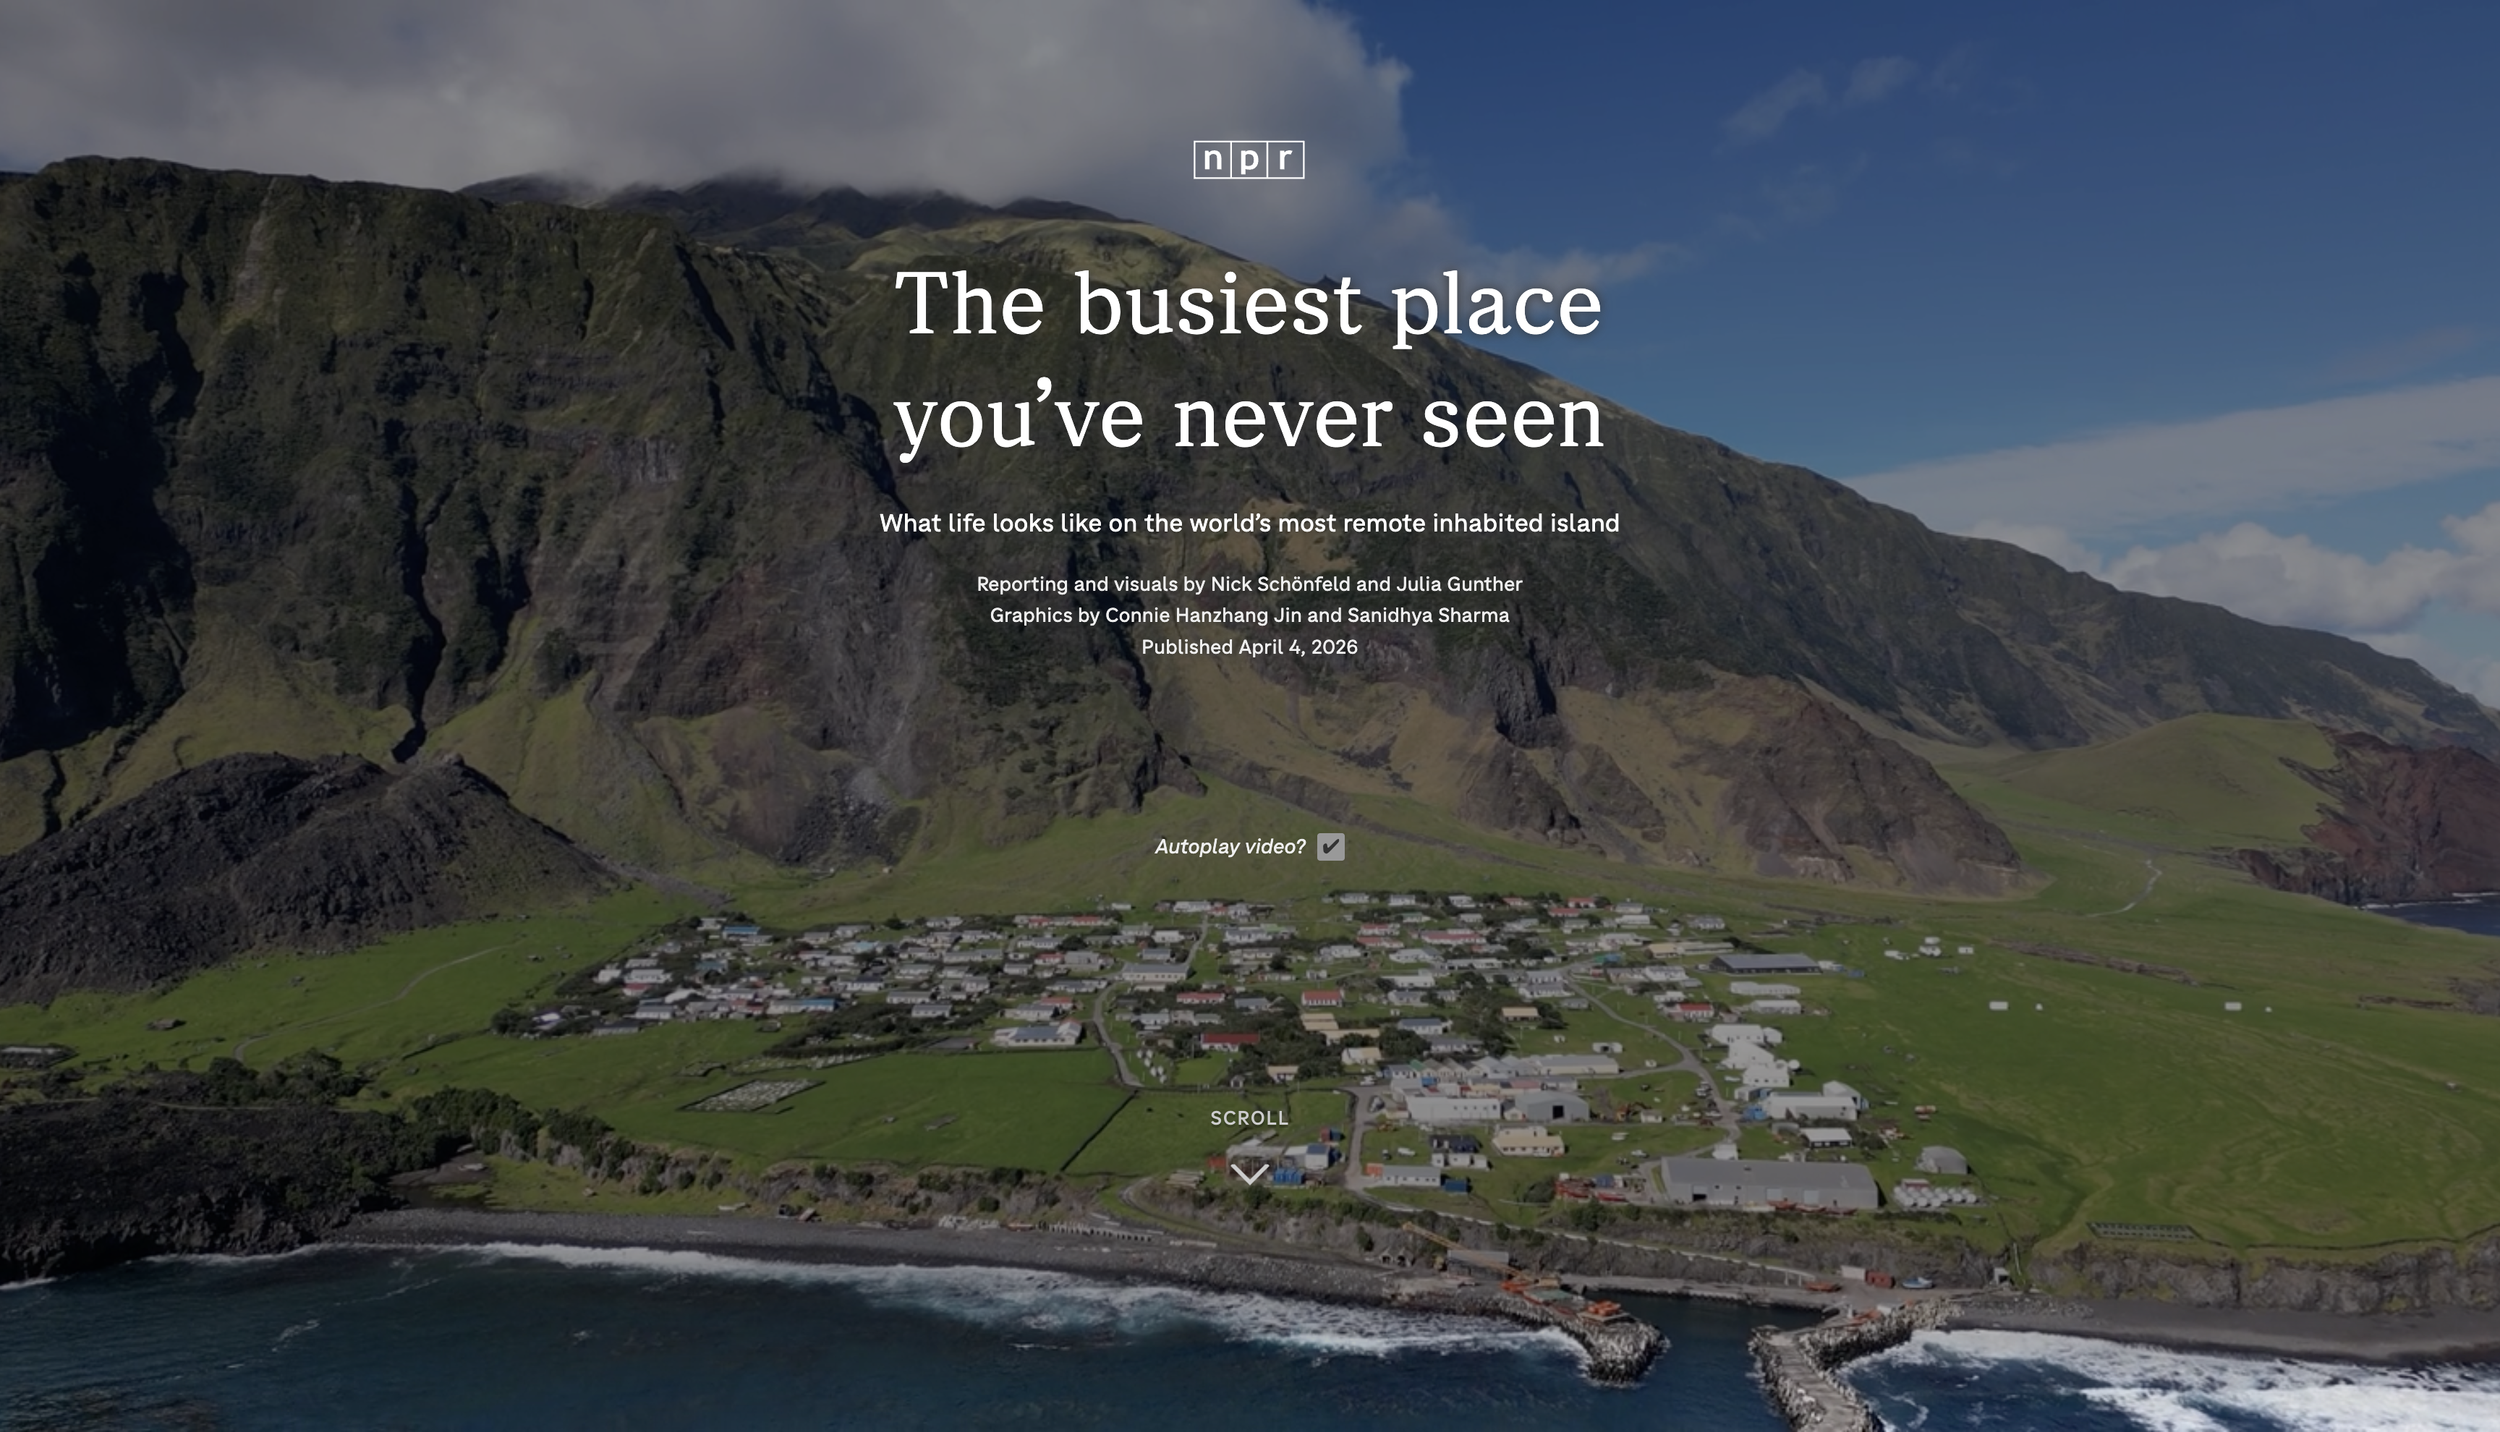
the busiest place you've never seen
JAN. 6, 2021: A VISUAL ARCHIVE OF THE CAPITOL ATTACK
It's harder to get home insurance. That's changing communities across the U.S.
FAILURE TO THRIVE WILL KILL YOU

Why do we hear the same Christmas songs year after year?
A guerrilla gardener installed a pop-up wetland in the LA River. Here's how — and why
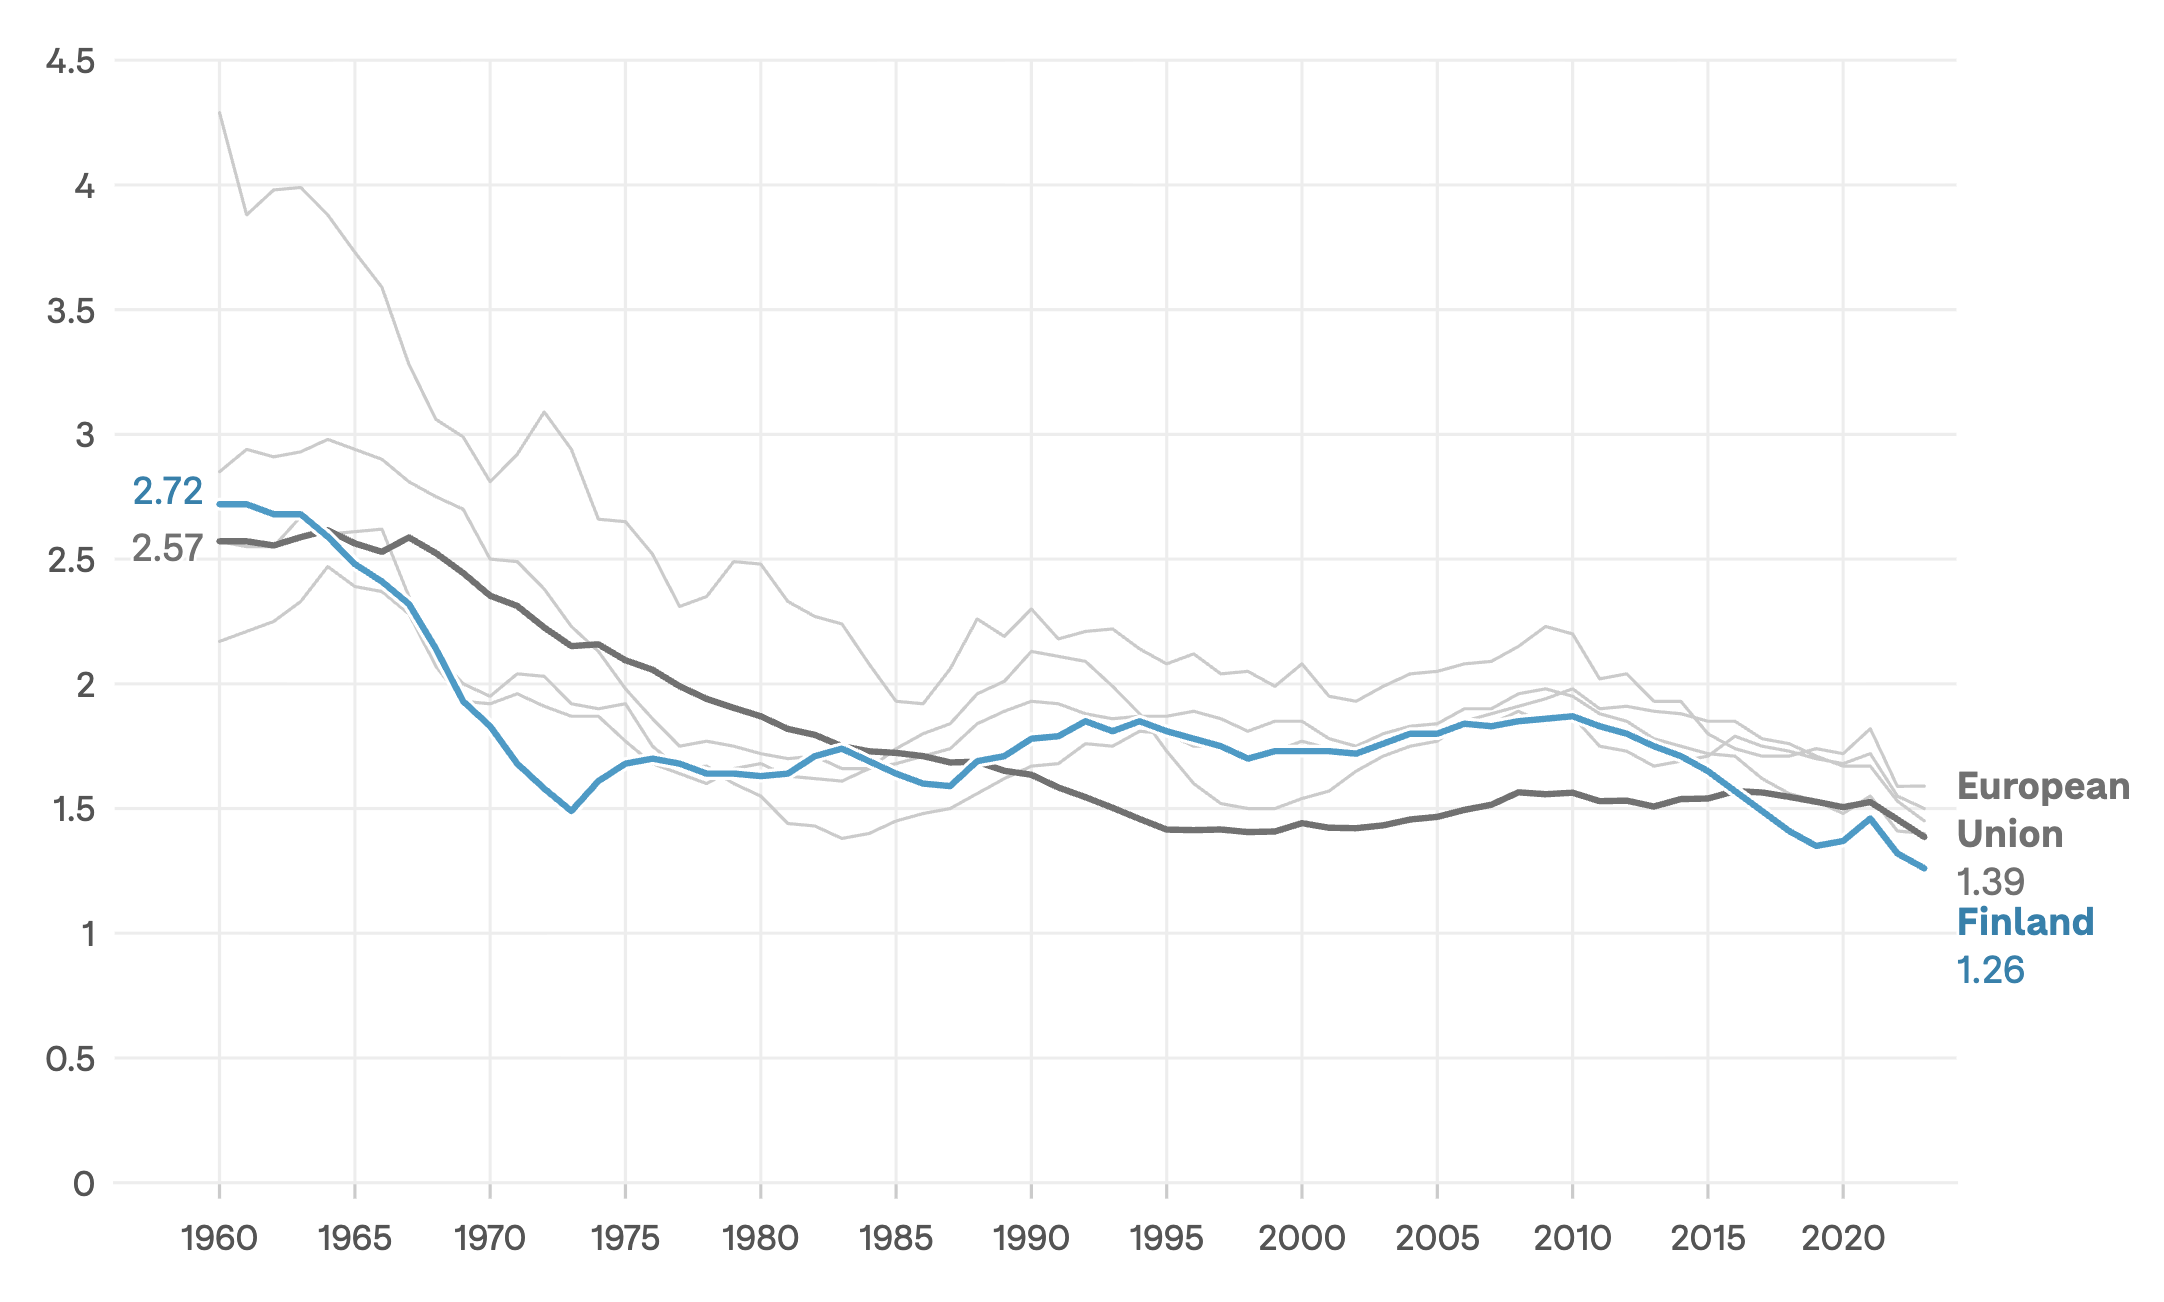
Finland's stubbornly low birth rate shows why a population shift may be inevitable
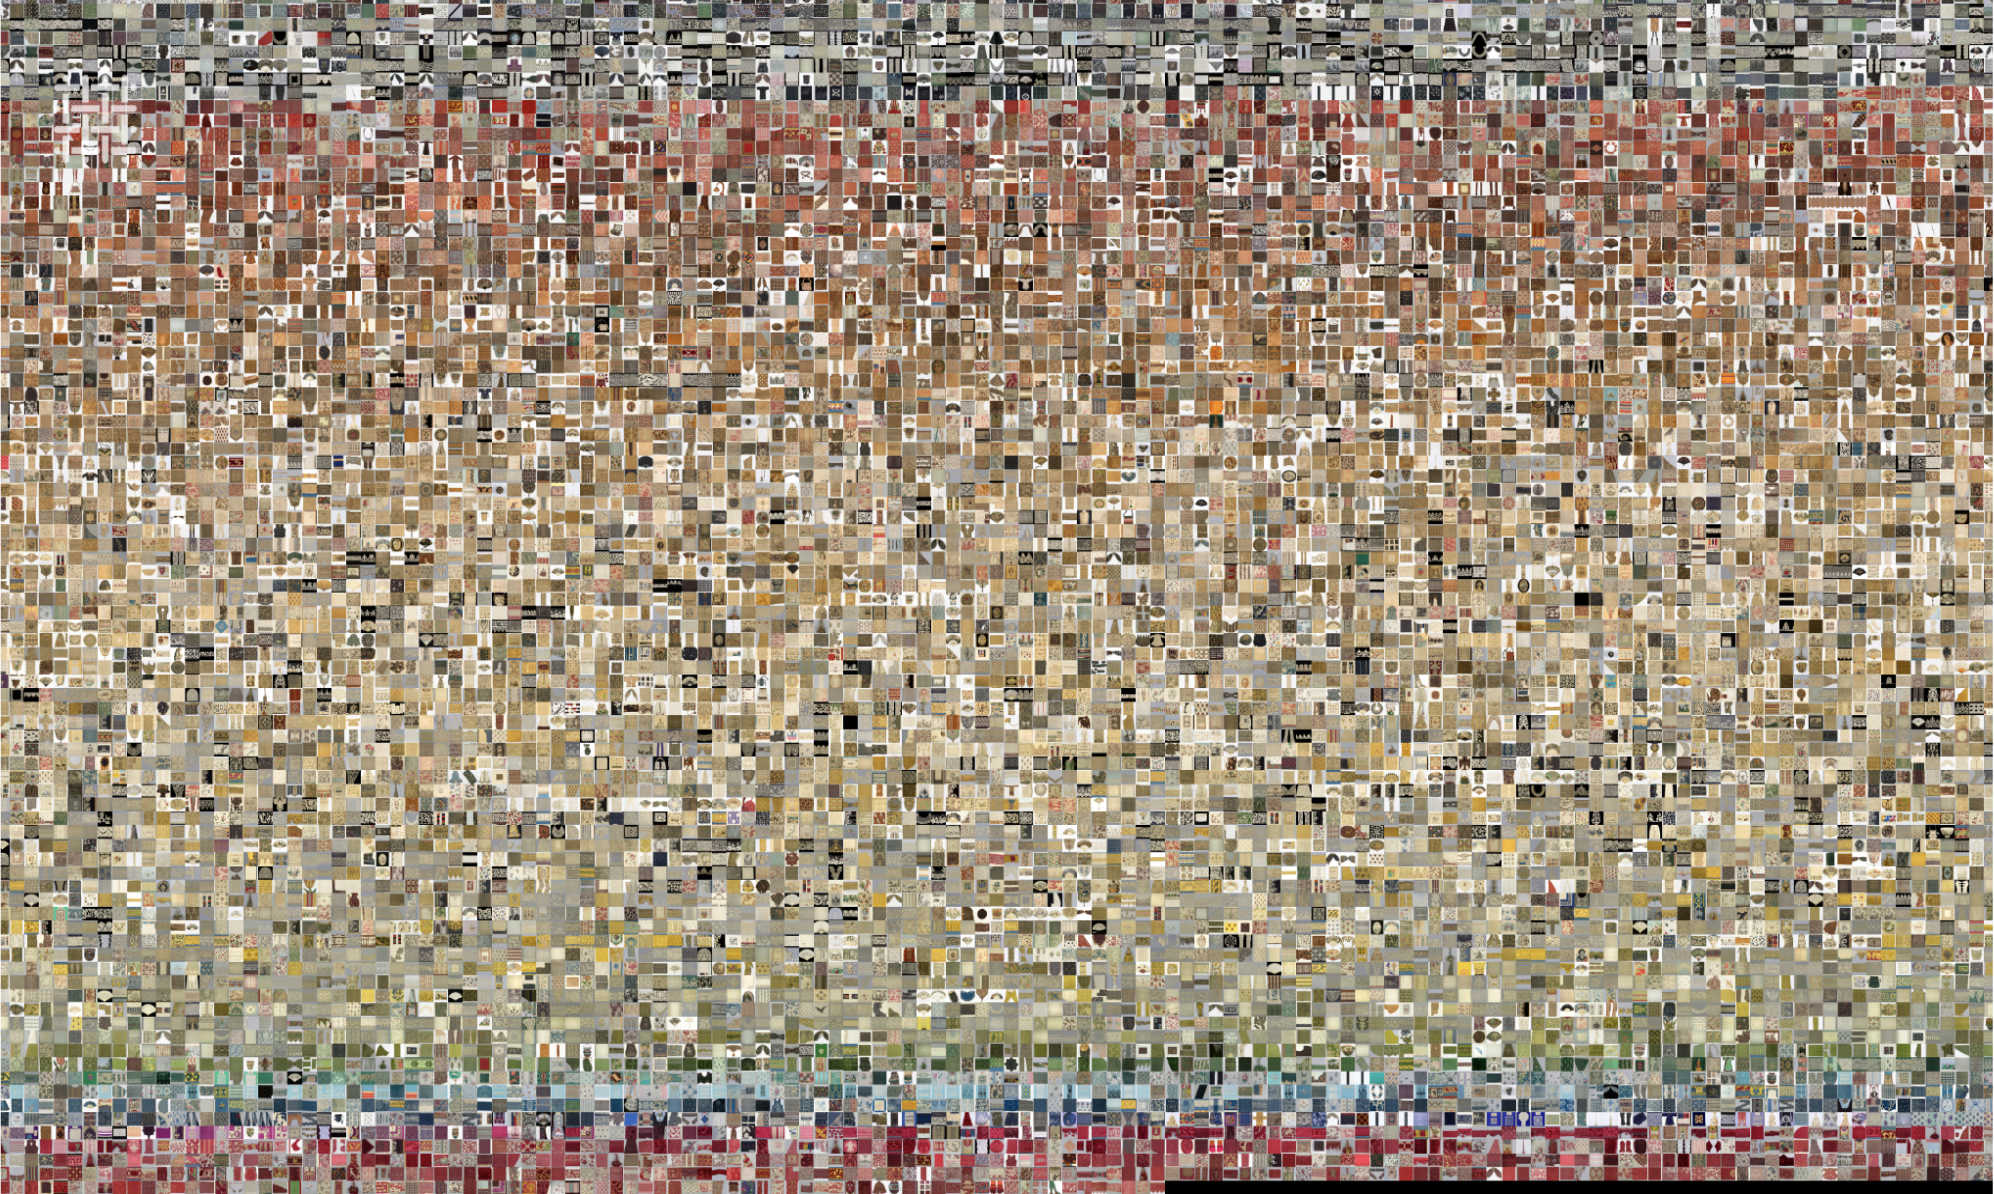
WORN WORLDS
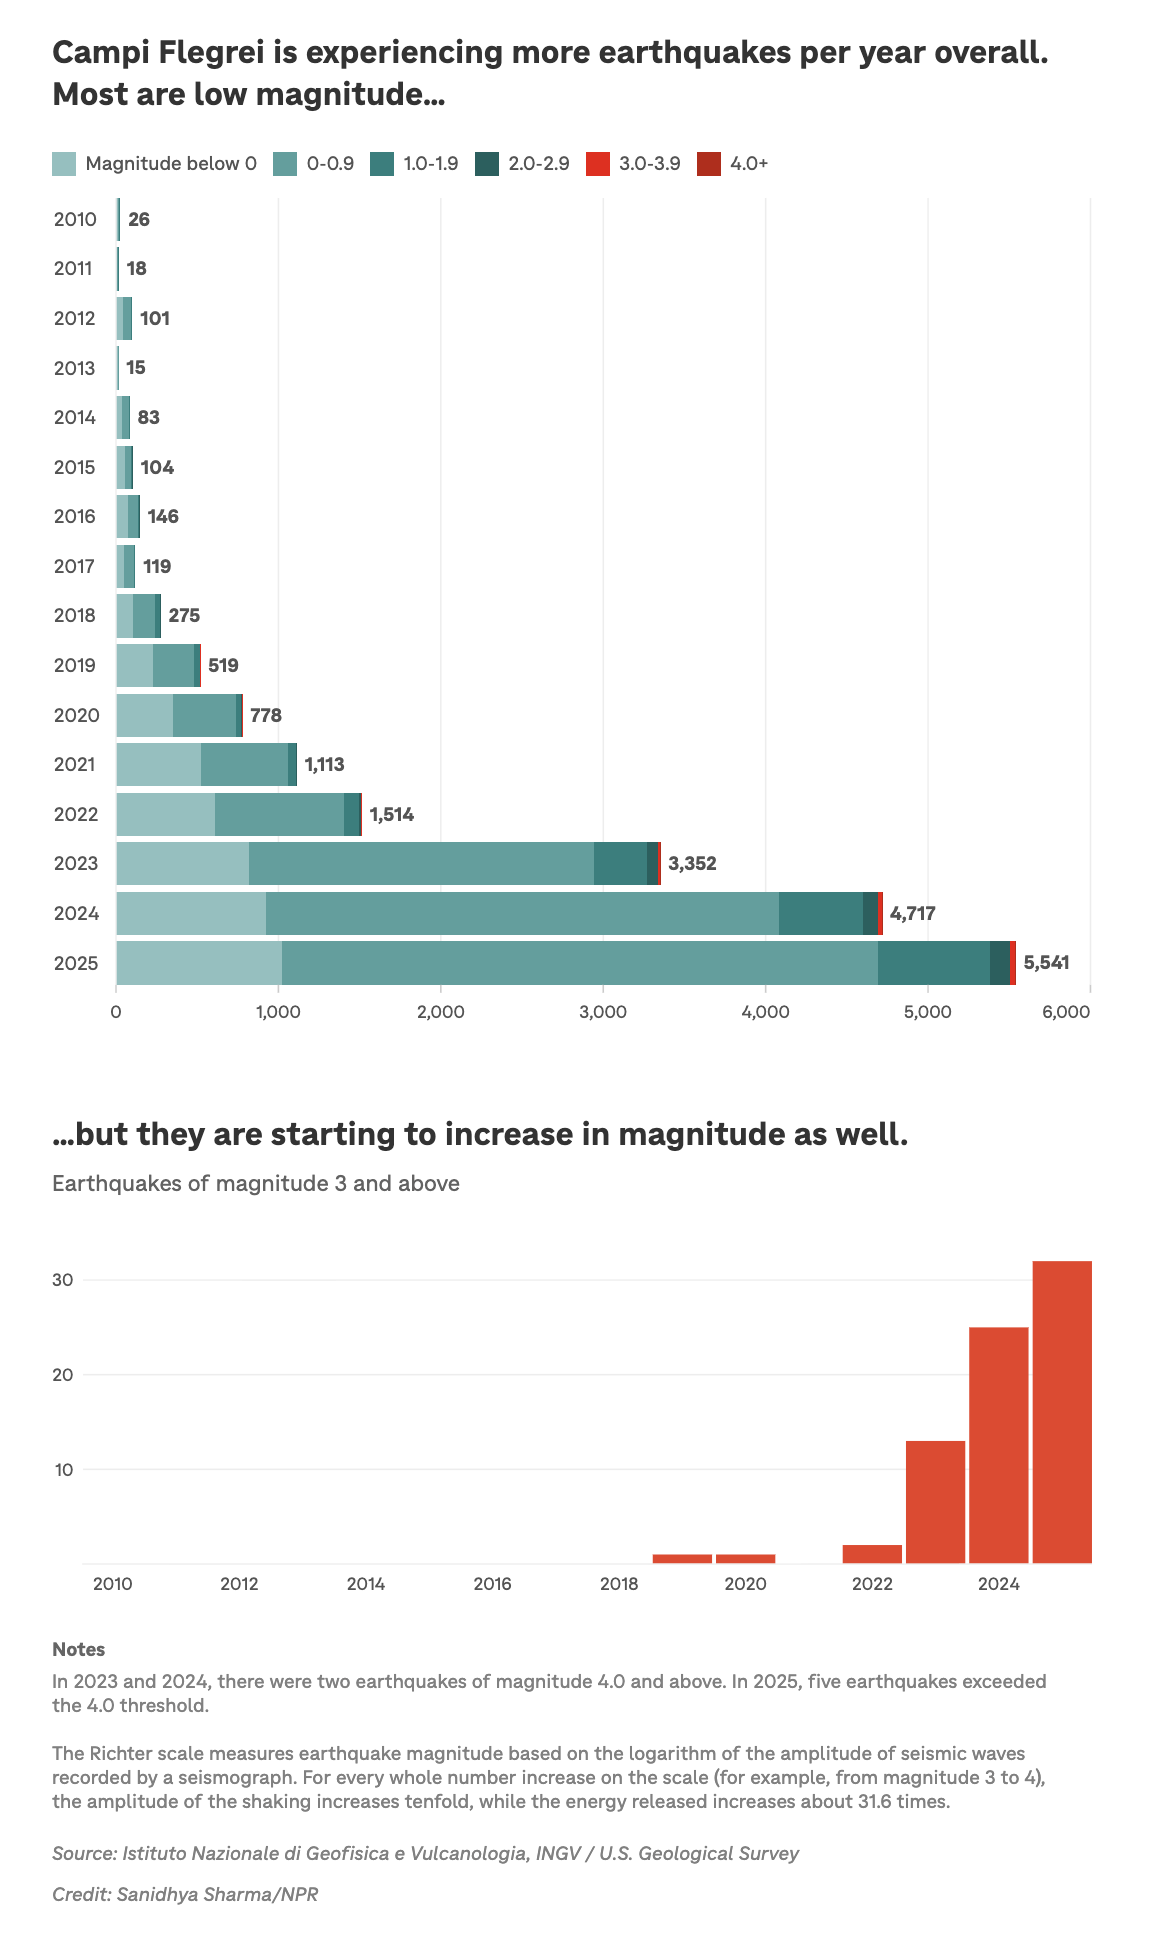
"Italy's Campi Flegrei supervolcano is stirring. Could this seismic giant soon erupt?"
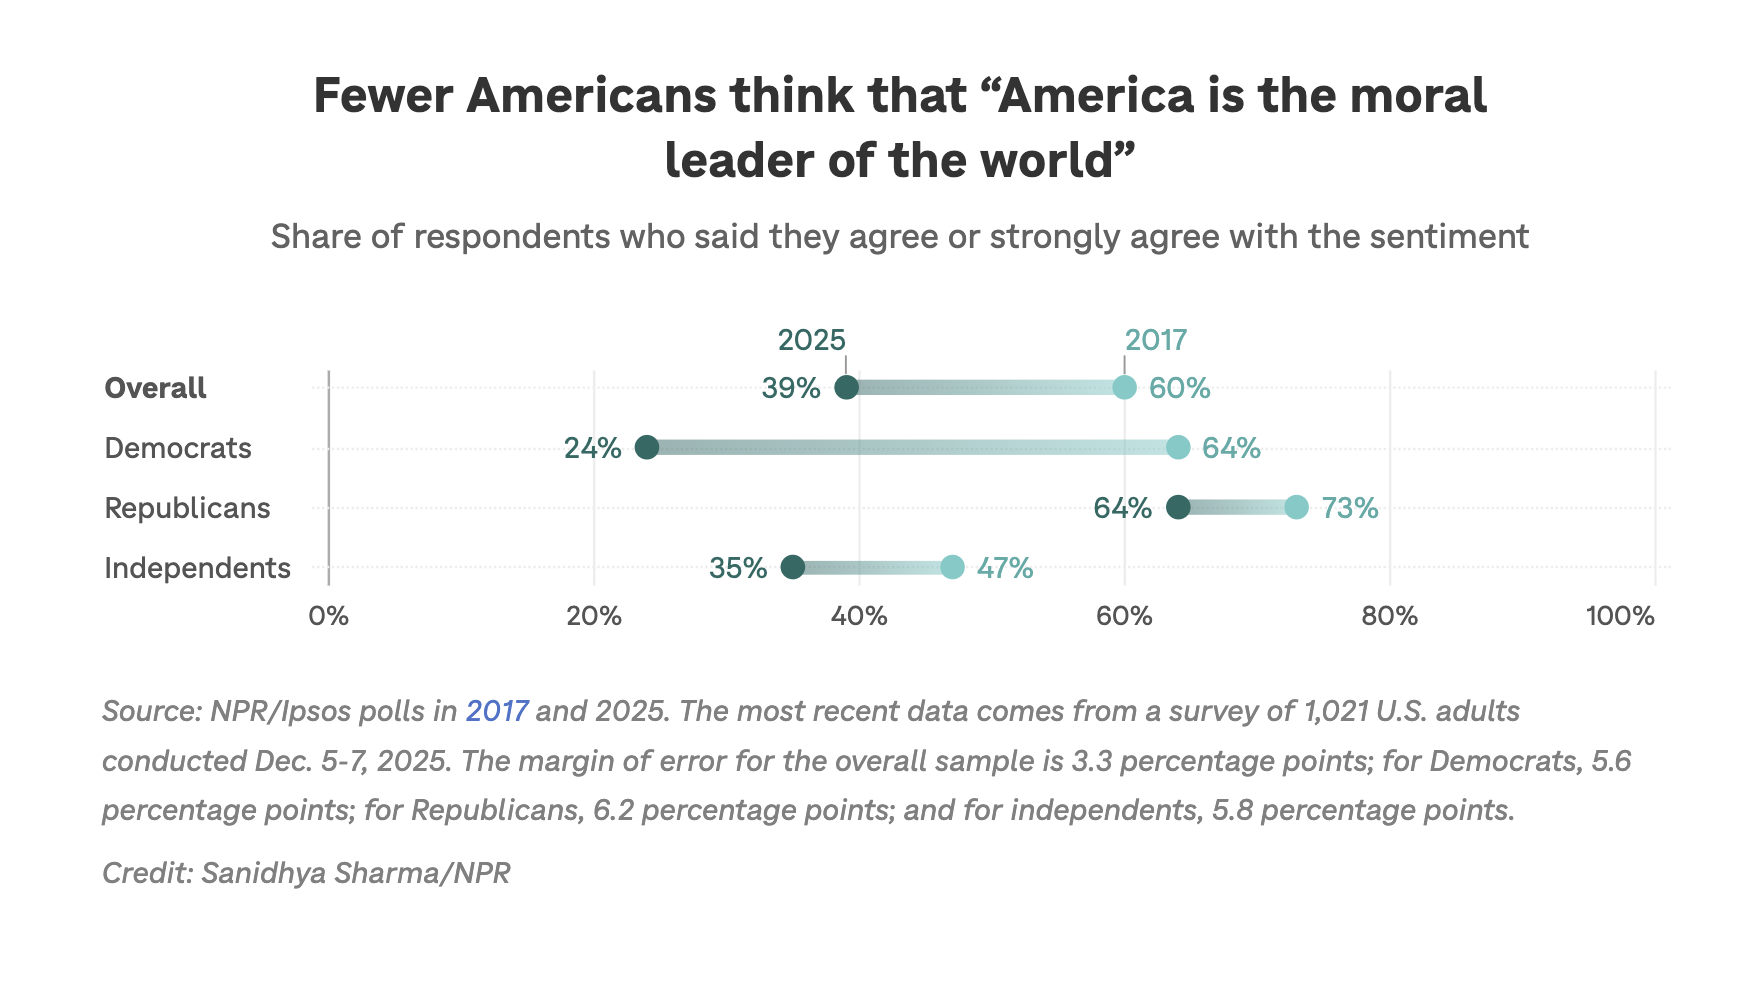
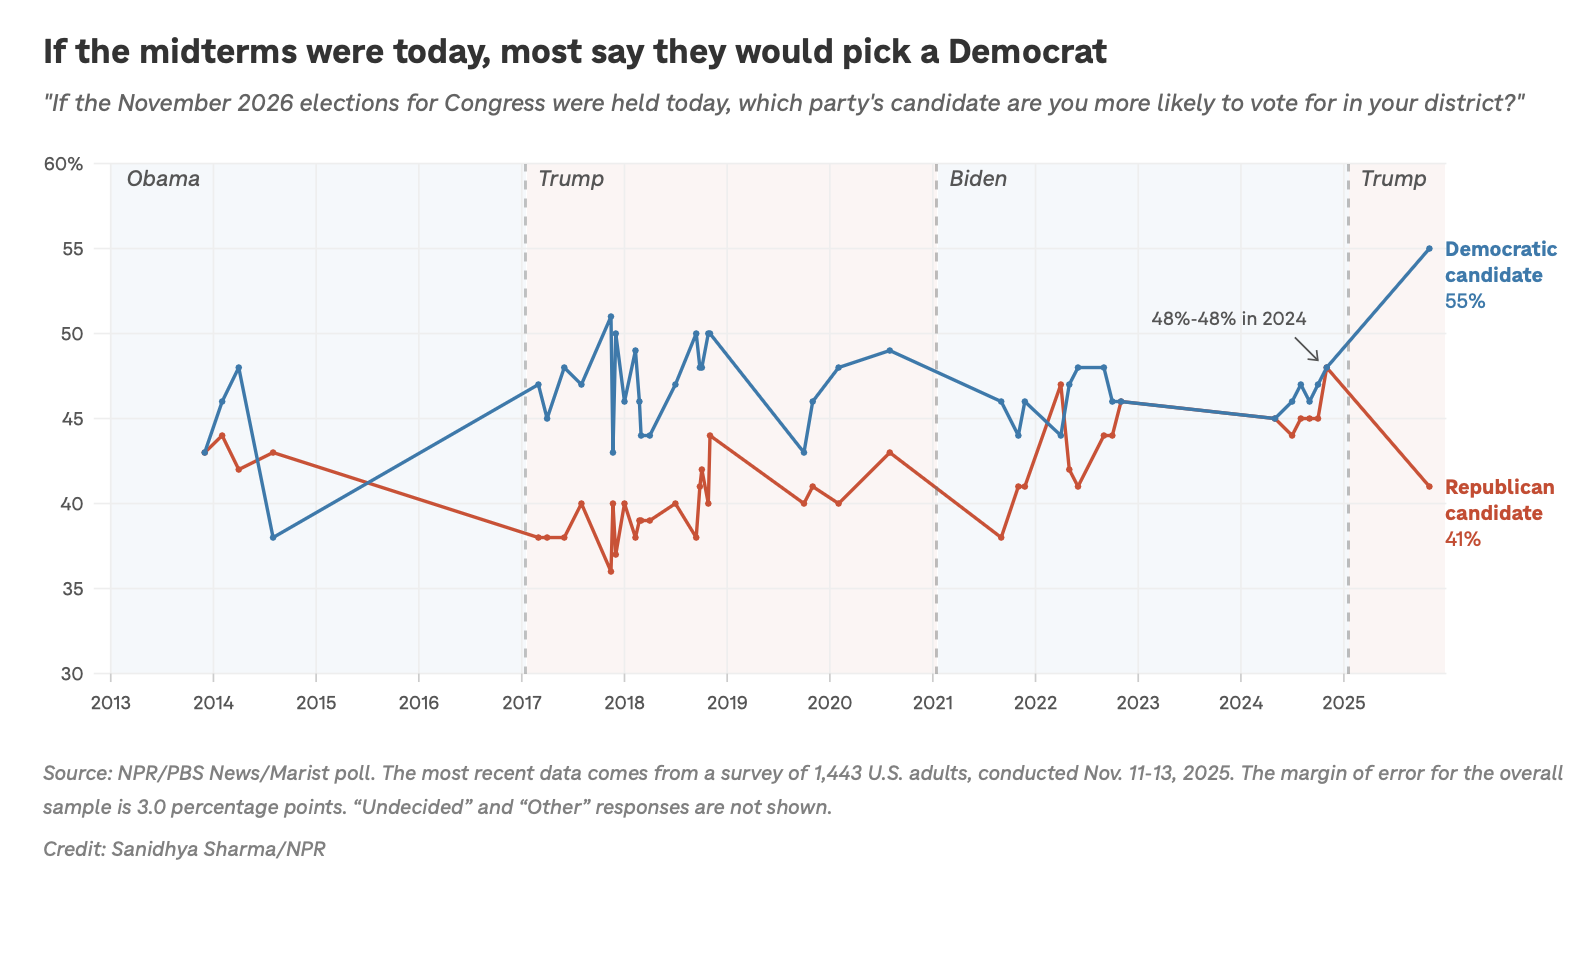
NPR/Ipsos poll: Many Americans say the U.S. is not a moral leader, but want it to be

WHAT TIME IS IT?
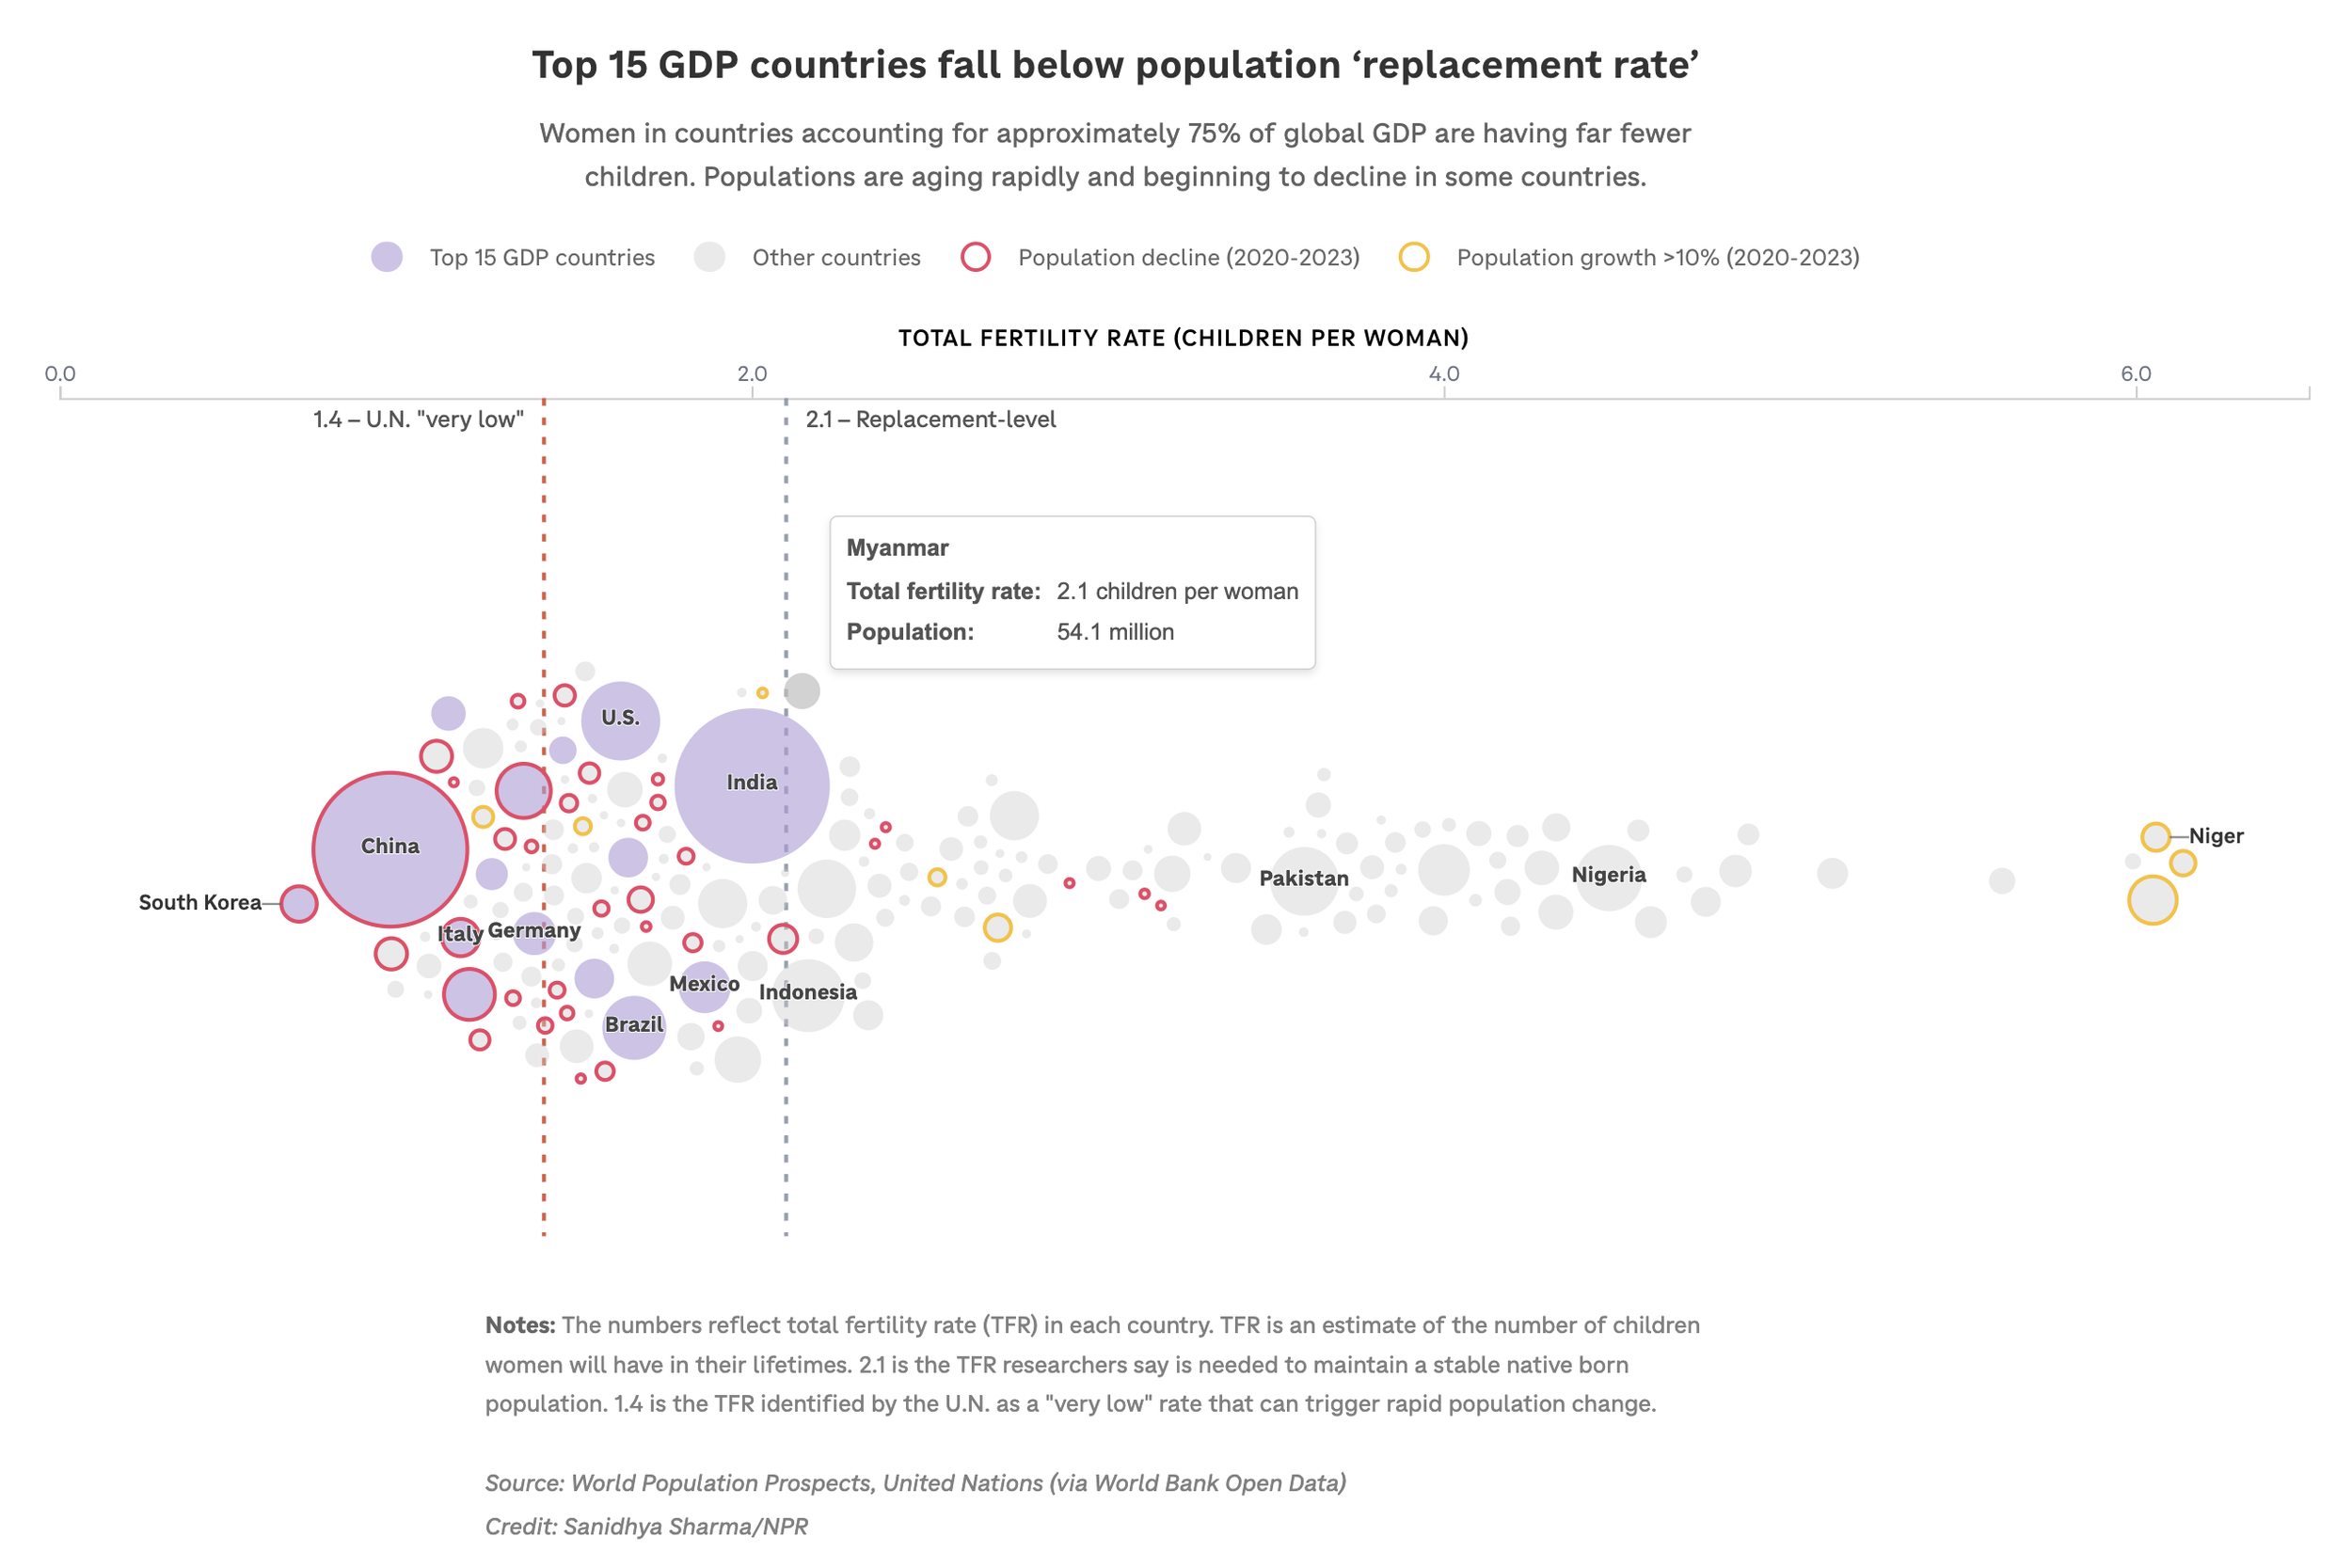
People are having fewer kids. Their choice is transforming the world's economy
Why home insurance is unaffordable, even in places without wildfires or hurricanes

BEHIND THE BADGE
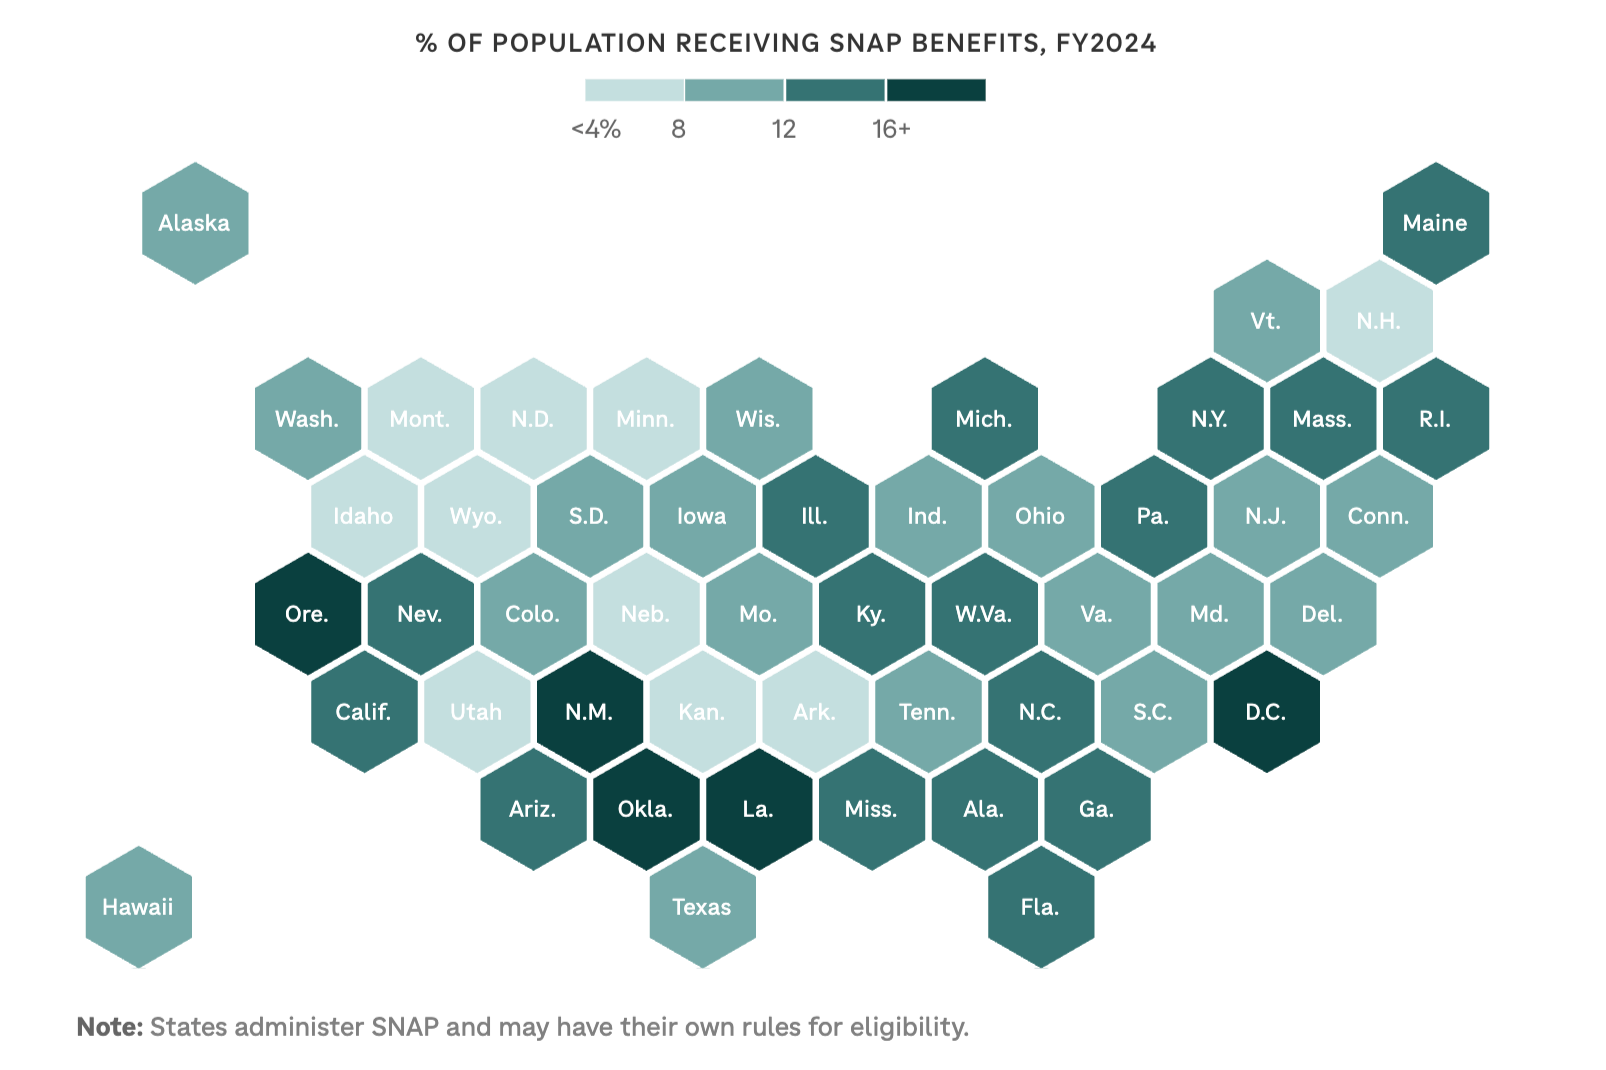
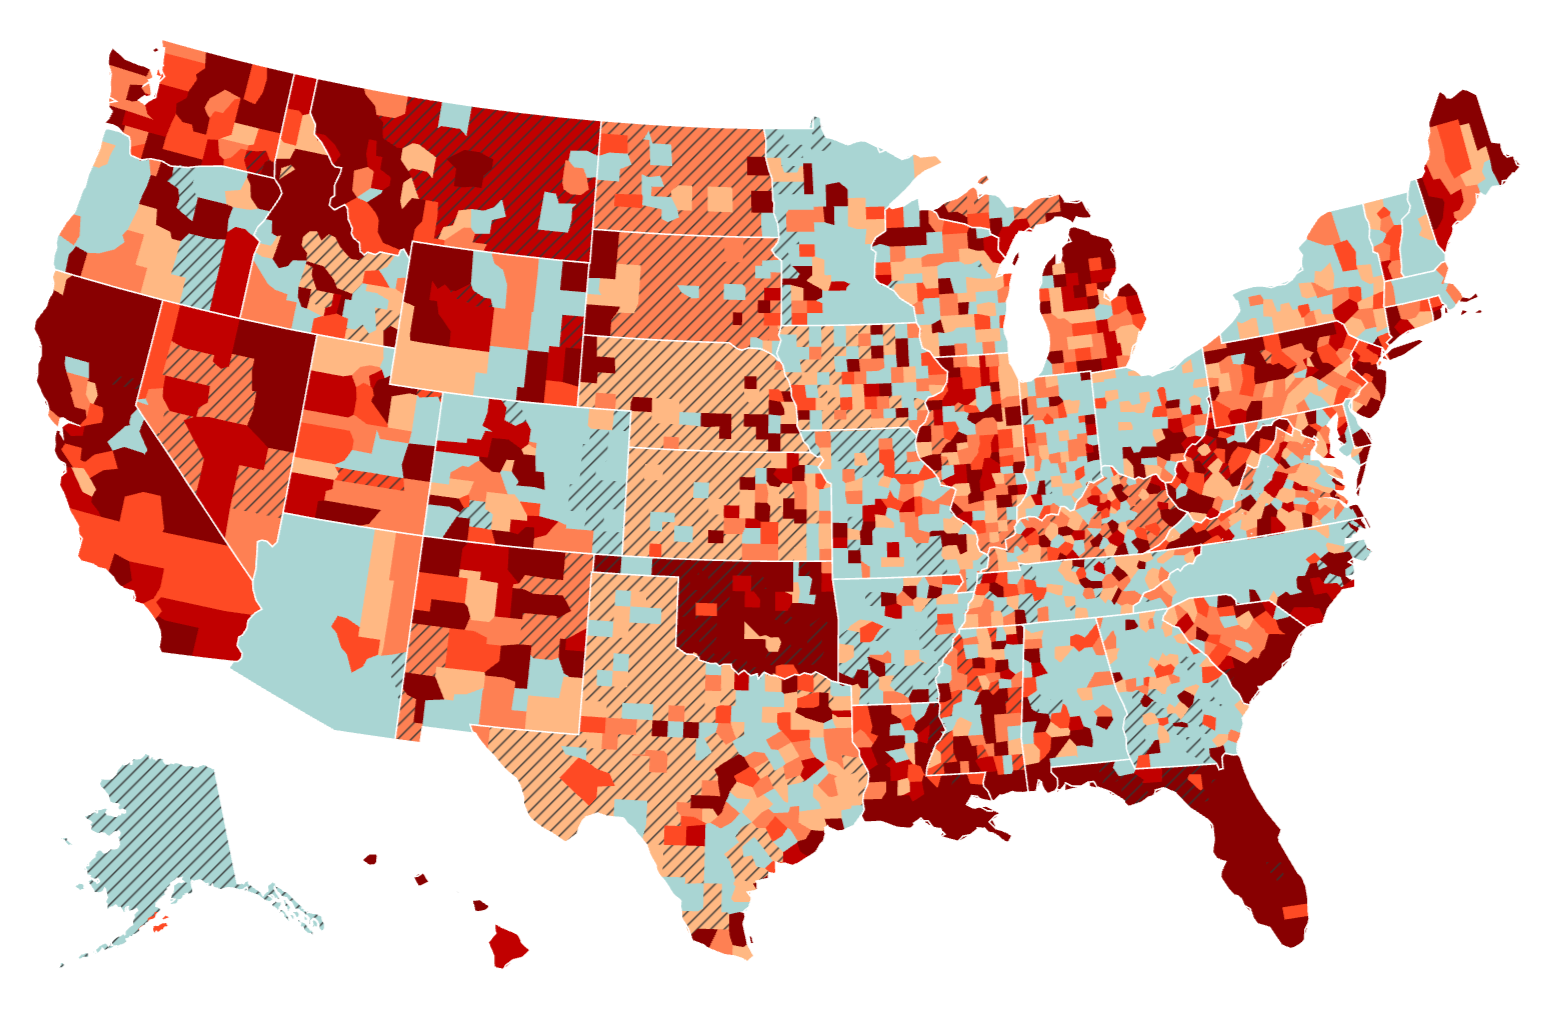
SNAP runs out of money Nov. 1. Here's what that means in your state