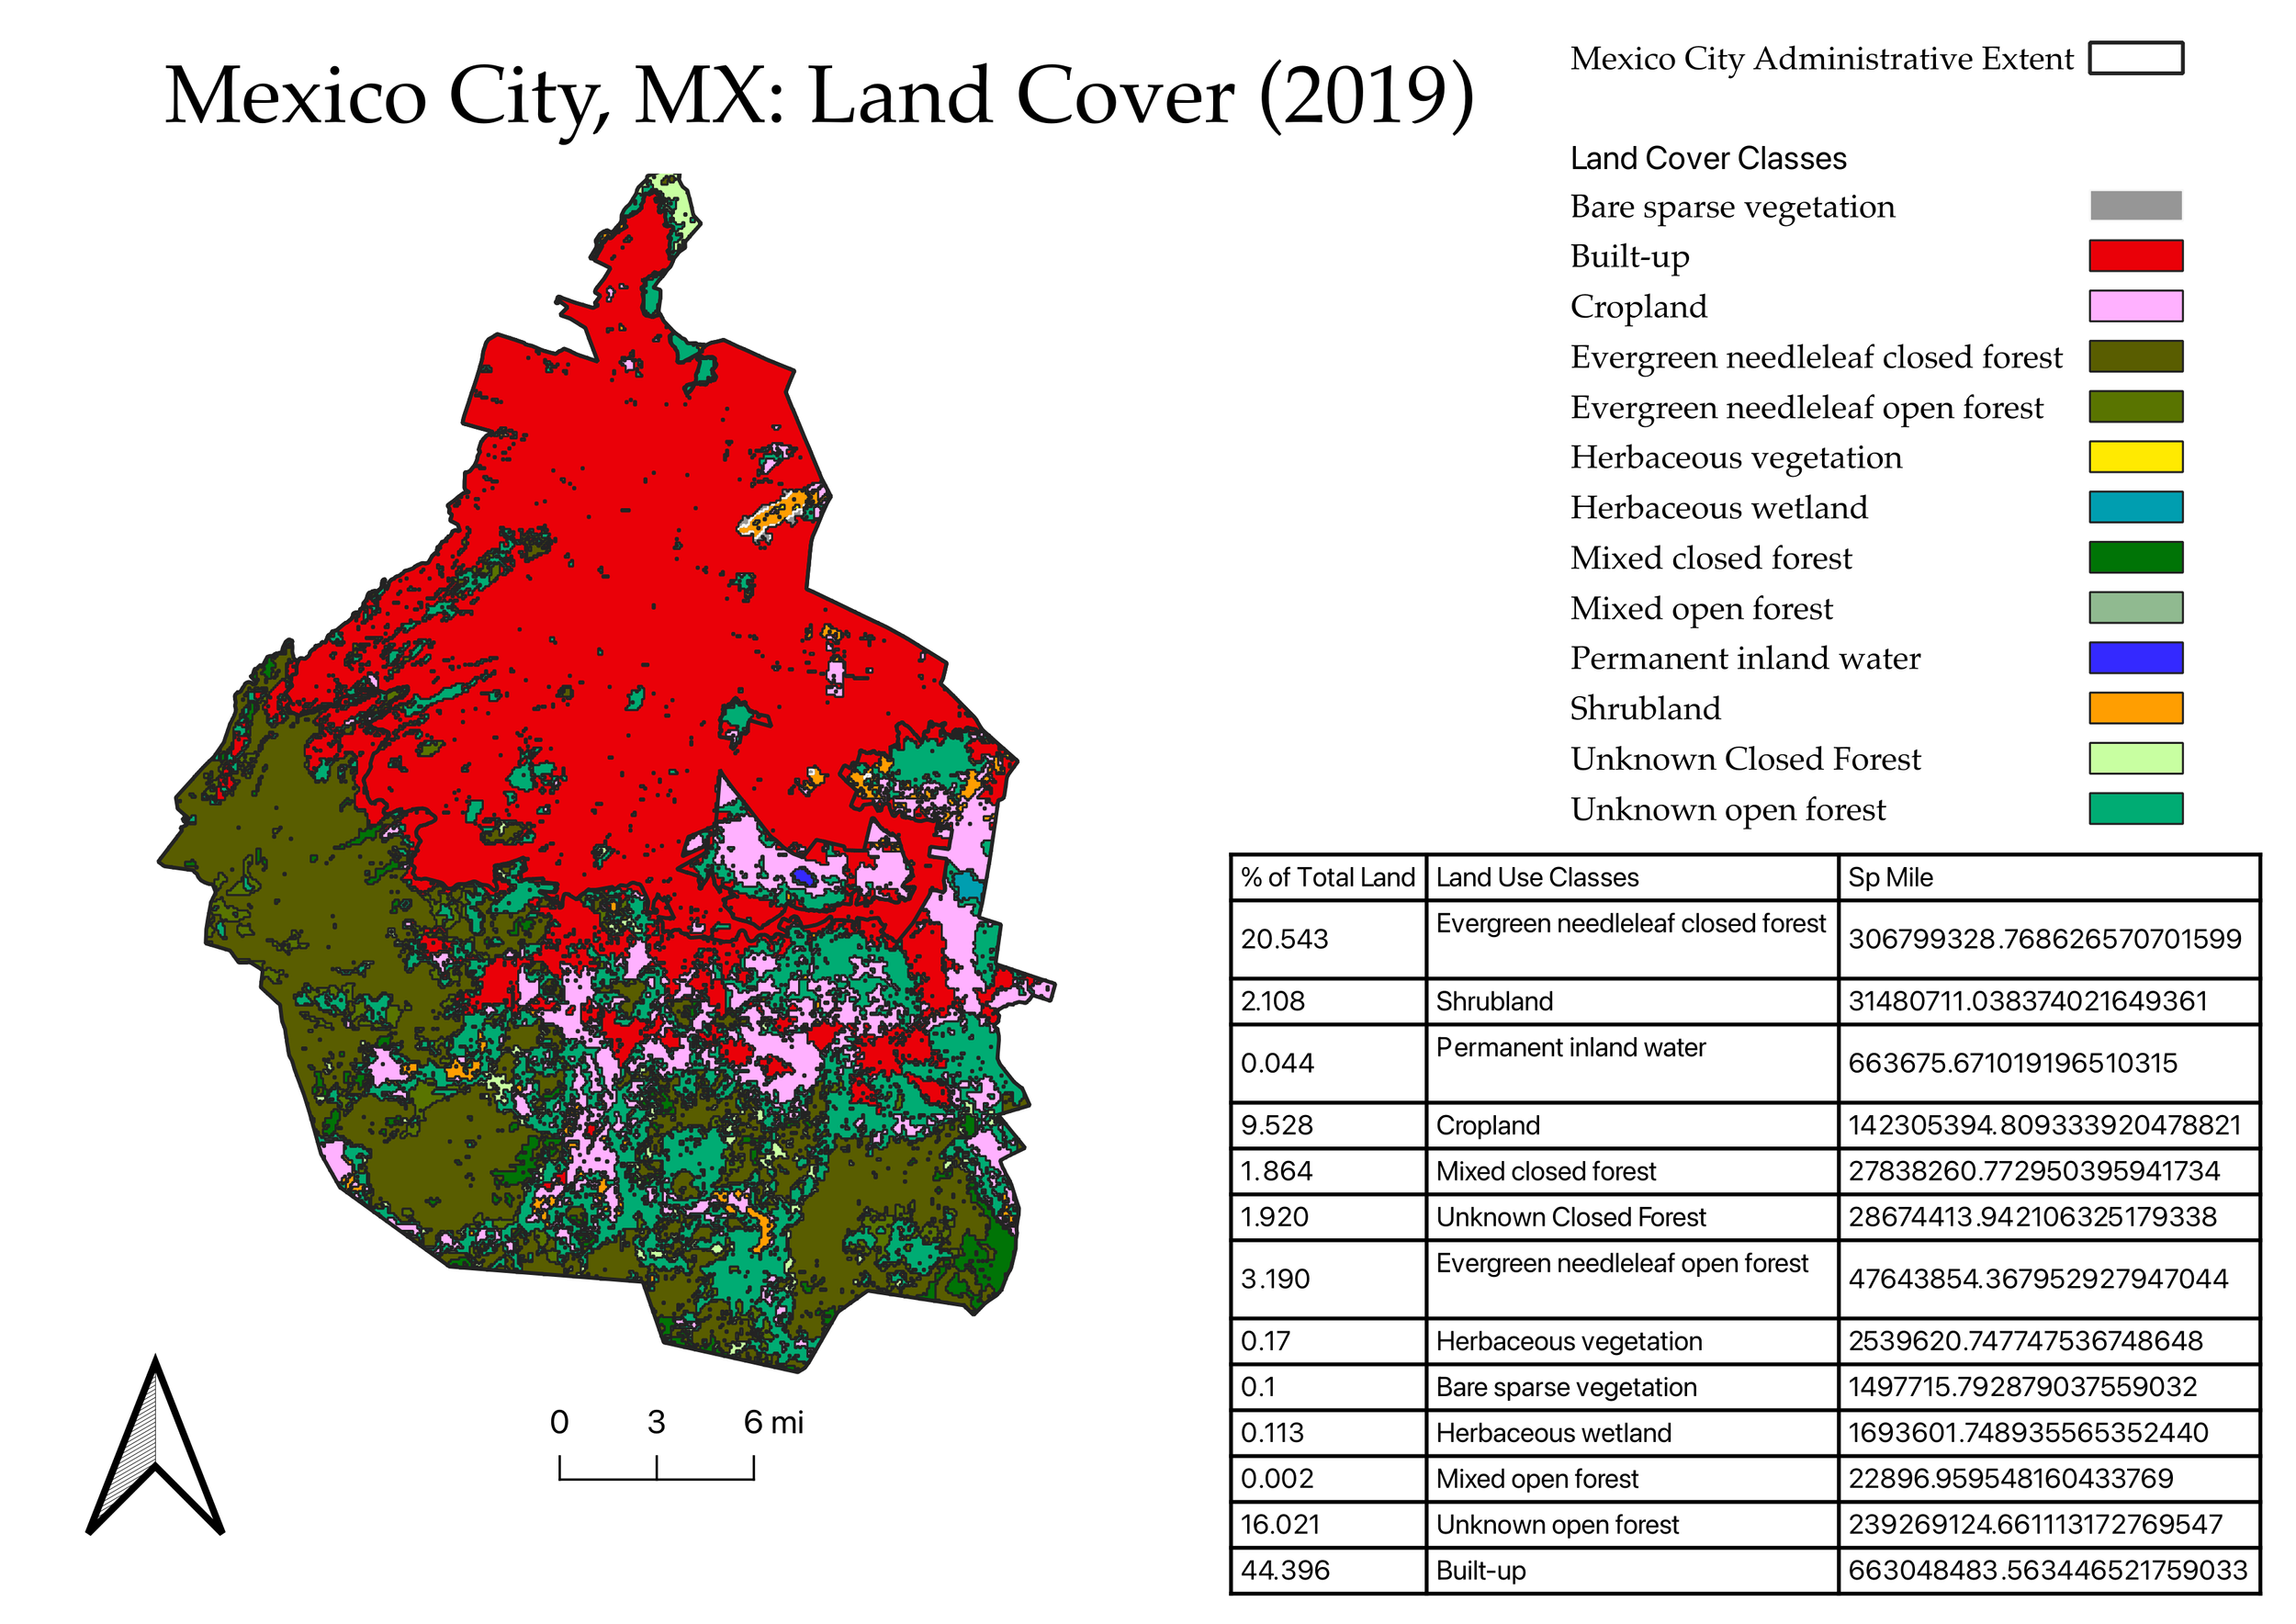
For this assignment, I selected Mexico City to explore the use of map projections in spatial analysis. Using OpenStreetMap and Copernicus Global Land Cover (2019) data, I extracted administrative boundaries and clipped a raster tile to the city extent. After reprojecting the data to the appropriate UTM Zone 14N, I polygonized the raster, dissolved by land cover type (DN), and calculated the percentage of total land area by class. The final map visualizes Mexico City’s diverse land cover—ranging from built-up zones to shrubland—using a clear legend, summary table, and accurate planar calculations within a conformal projection system.